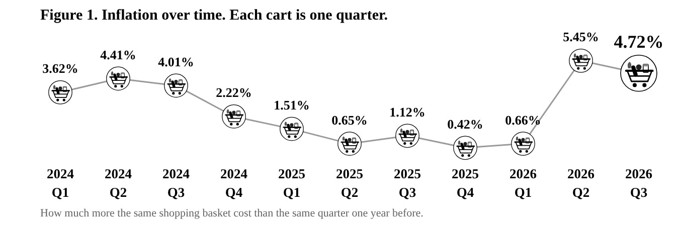
SINT MAARTEN (GREAT BAY) - The Department of Statistics (STAT) reports that the cost of everyday goods and services in St. Maarten rose to 4.72% in the third quarter (Q3) of 2026 than they did one year earlier. This rise in prices is called inflation.
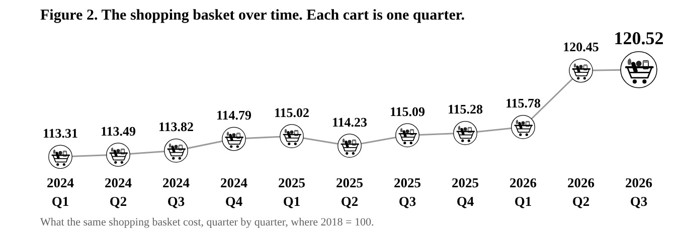
Quarter-on-Quarter (QoQ), between the second quarter (April to June) and the third quarter (July to September) of 2026, prices went up by 0.06%. That is about 6 cents for every 100 XCG.
↑ 4.72% ↑ 0.06% 120.52 Q3 2026 versus Q3 2025 Q3 over Q2 Price index (CPI) This is inflation Quarter-on-Quarter (QoQ) 2026 Q3 · 2018 = 100
Electricity and fuel
The GEBE fuel clause, the part of the electricity bill that changes with the price of fuel, went up 7.95% compared with Q2 and up by 34.26% compared with Q3 one year ago.
At the pump, gasoline went down 2.94% and diesel went down 6.26% compared with Q2. Compared with one year ago, gasoline is up 34.46% and diesel is up 43.60%.
Q3 over Q2 Q3 2026 versus Q3 2025 GEBE fuel clause ↑ 7.95% ↑ 34.26% Gasoline (pump price) ↓ 2.94% ↑ 34.46% Diesel (pump price) ↓ 6.26% ↑ 43.60%
"Q3 over Q2" compares July, August and September with April, May and June. "Q3 2026 versus Q3 2025" compares July, August and September with the same three months one year ago.
Fuel prices and the war in the Middle East
The war involving Iran, the United States and Israel began on 28 February 2026 and pushed up world oil prices. St. Maarten imports its fuel, so this event has had an effect on prices here.
The figures show that the largest increases came in the second quarter of 2026 (April to June), the first full quarter after the war began. Compared with the first quarter of 2026, gasoline at the pump went up 40.27%, diesel went up 51.20% and the GEBE fuel clause went up 27.12%. Inflation went from 0.66% in Q1 2026 to 5.45% in Q2 2026.
In Q3 2026, pump prices went down slightly compared with Q2 but were still more than one-third higher than in Q3 2025. Transport costs were 19.03% higher than one year earlier.
The four biggest spending categories
The weight shows how much of a typical household’s spending goes to each category. These four categories have the largest weights in the CPI.
Category Weight Q3 over Q2 Q3 2026 versus Q3 2025 What drove it Q3 Housing, water, electricity, gas and other fuels 36.13% ↑ 0.70% ↑ 2.48% Electricity (+4.61%) Transport 14.58% ↓ 1.08% ↑ 19.03% Fuel for vehicles (-3.91%) Miscellaneous goods and services 13.40% ↓ 0.22% ↓ 0.54% Personal care (-2.13%) Food and non-alcoholic beverages 7.16% ↑ 0.51% ↑ 4.16% Meat (+2.64%)
To see the full report, including how the GEBE fuel clause and fuel prices have changed over time, please visit our website at stats.sintmaartengov.org or contact us at This email address is being protected from spambots. You need JavaScript enabled to view it..